How images are made
Crab Nebula in Five Wavelengths: How the 2017 Composite Was Built
Five telescopes, five slices of the spectrum and one color wheel divided into equal steps: the making of the 2017 Crab Nebula composite.
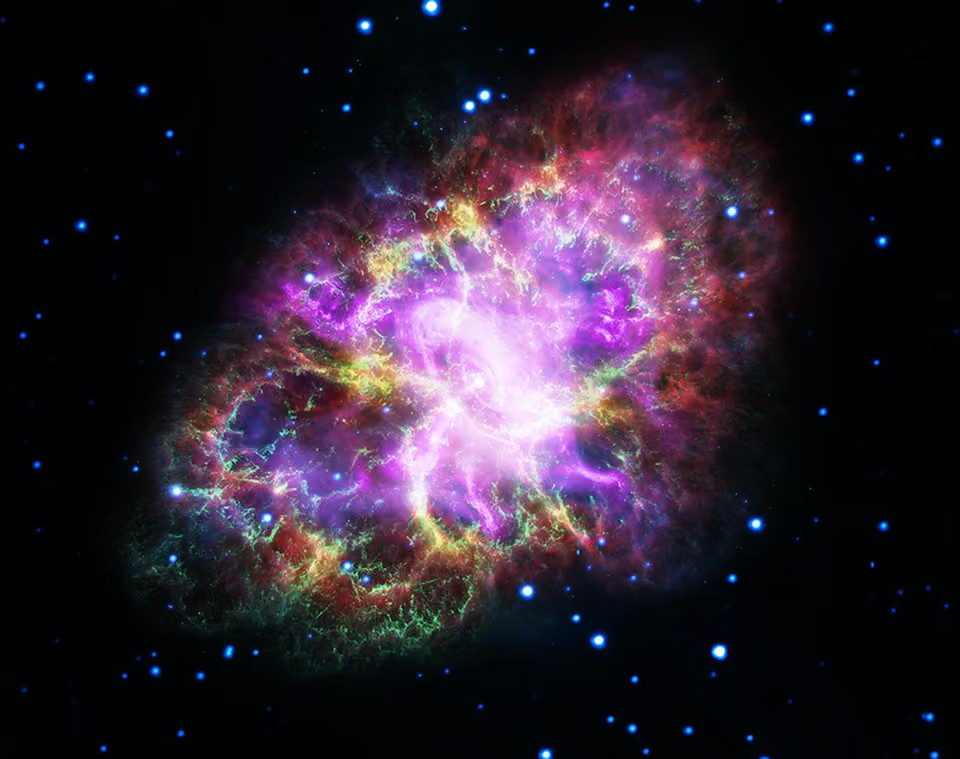
In 1054 sky watchers in China recorded a new star in Taurus bright enough to be seen in daylight for months. What remains of that explosion is the Crab Nebula, and in May 2017 NASA released a portrait of it assembled from five observatories at once: the Very Large Array for radio waves, Spitzer for infrared, Hubble for visible light, XMM-Newton for ultraviolet and Chandra for X-rays. Each instrument sees a different nebula. The picture at the top of this page puts all five into a single frame.
The object behind the colors
The Crab lies about 6,500 light-years away. Measuring how fast its debris is still flying outward and running the clock backward points to an explosion around the year 1054, which matches the Chinese record. The English astronomer John Bevis spotted the cloud in 1731, and Charles Messier came across it while searching for comets and made it the first entry in his catalog, M1. The nickname came later, from William Parsons, the third Earl of Rosse, whose drawing of the nebula suggested a crab's legs.
At the center sits a pulsar, a neutron star about 20 miles across that holds more mass than the Sun and spins so fast that its beam sweeps past Earth every 33 milliseconds. Its magnetic field and the particles it flings outward power almost all of the light in the nebula, from radio to X-rays. That single engine is the reason a multiwavelength view of the Crab makes sense: every band records the same source of energy at a different stage of losing it.
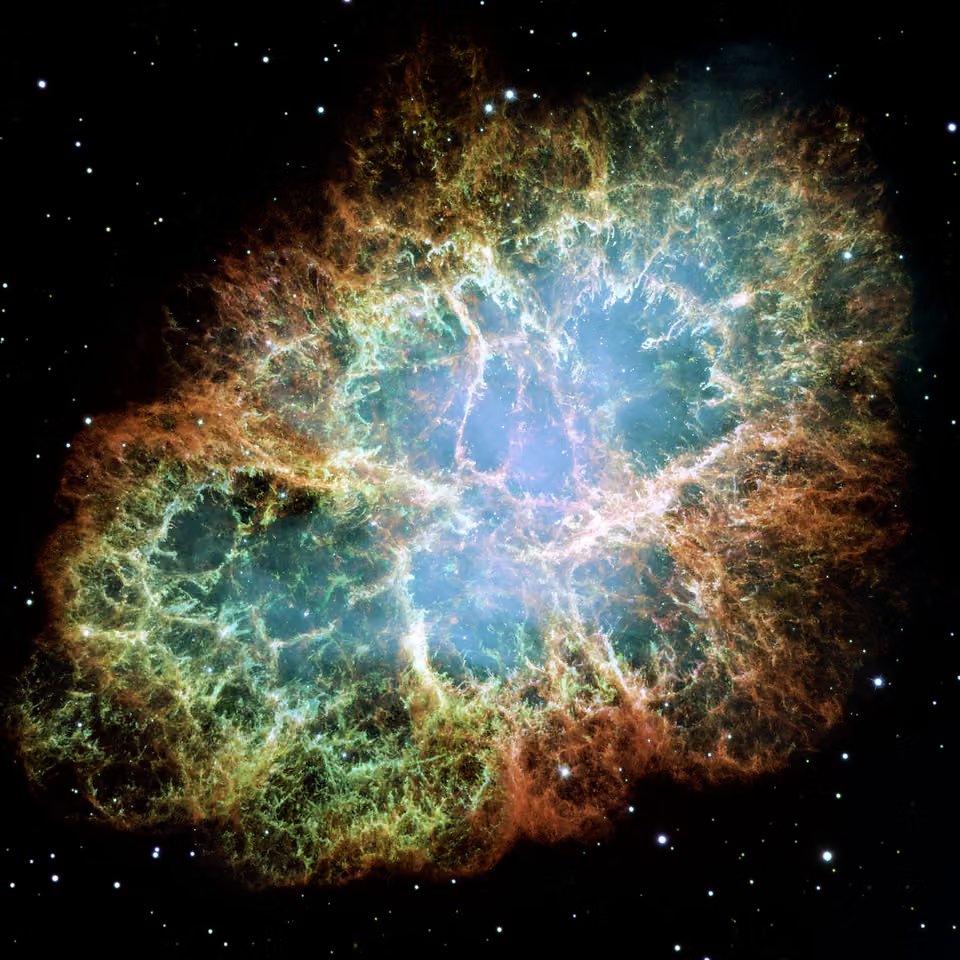
The visible-light portrait from Hubble, assembled from 24 exposures with the Wide Field and Planetary Camera 2, shows the filaments in fine detail but only one slice of the story.
Why the eye would not see this
A natural question about any space picture is whether it shows what a person would see from close by. For the Crab, and for almost every nebula, the answer is no. The retina reacts to light as it arrives and keeps no running total. A camera on a telescope keeps collecting photons for minutes or hours and adds them up, so faint glow that the eye never registers builds into a visible signal.
A simple test makes the point. From a dark site the Orion Nebula is a dim gray smudge below Orion's belt, yet long exposures turn the same patch of sky into the colorful cloud below. The color is there in the light; human vision is too insensitive at low brightness to pick it up.

A digital camera builds color from three channels, red, green and blue, each a black-and-white record of how much light fell in that band. Astronomical cameras work the same way, with one difference: the filters can be far narrower. A narrowband filter passes a sliver of the spectrum a few nanometers wide, often centered on light from one element, and blocks everything else. Every color picture from a space telescope is a set of such grayscale frames, each given a hue and stacked.
Five bands, one color wheel
Three frames map neatly onto red, green and blue. Five do not. A first attempt that gave each band the color it "ought" to have produced a handsome picture but a confusing one, because the hues no longer said anything reliable about wavelength.
The solution was to treat the color wheel as a ruler. A full turn is 360 degrees; split into five equal parts it gives steps of 72 degrees of hue. The radio data, the lowest-energy light, took red at the start of the wheel. Each band of higher energy moved one step further around: infrared to yellow, visible light to green, ultraviolet to blue and X-rays to purple. The order of the colors now matches the order of the wavelengths, longest to shortest, which is the same rule used for ordinary three-filter Hubble images and explained in Are the Colors Real?.
| Filter | What it records | Shown as |
|---|---|---|
| Radio (VLA) | Electrons spiraling in the nebula's magnetic field, the longest wavelengths in the set | Red |
| Infrared (Spitzer) | Warm dust and synchrotron glow | Yellow |
| Visible (Hubble) | Glowing gas filaments of the expanding debris | Green |
| Ultraviolet (XMM-Newton) | Hotter, more energetic emission closer to the pulsar | Blue |
| X-ray (Chandra) | The compact, most energetic region around the pulsar | Purple |
With hue fixed, brightness in each layer still follows the data. That is why the result reads as a nested structure. The red radio glow is the largest and smoothest envelope. The yellow infrared and green visible filaments sit inside it. Blue ultraviolet light gathers closer to the middle, and the purple X-ray region is a compact knot around the pulsar, because the most energetic particles lose their energy fastest and never travel far from the source.
What the comparison tells astronomers
Picture-making was not the goal of the observations. The paper that accompanied the release compared the shapes the Crab shows in each band, because a structure that appears in one wavelength and not in another says something about the physics producing it. One example: in places the radio emission traces arcs that do not line up with the visible filaments. The authors read these as signs of strong magnetic fields holding material in loops, similar to the arcades of hot plasma seen above active regions on the Sun.
The same five-band data set was also released as an animation that steps through the wavelengths one by one, so the nebula changes shape as the colors switch. A still frame of the full stack, like the one above, is the compressed version of that sequence, and Hubble's own visible-light archive of the object is covered on the Crab Nebula (M1) page.
Questions readers ask
Is the Crab Nebula really this colorful?
No. The colors stand for wavelength bands, most of them invisible to people. Radio, infrared, ultraviolet and X-ray light cannot be seen at all, so they were given visible hues in order of wavelength. Even the visible-light component is far too faint for the eye to show in color through a telescope.
Why does the X-ray part look so small?
The X-rays come from the most energetic electrons close to the pulsar. Those particles radiate their energy away quickly, so they cannot travel far before fading. Lower-energy electrons survive longer and spread across the whole nebula, so the radio glow covers the largest area.
Which telescopes took the data?
The Karl G. Jansky Very Large Array supplied the radio map. The infrared came from the Spitzer Space Telescope, visible light from Hubble, ultraviolet from ESA's XMM-Newton and X-rays from the Chandra X-ray Observatory. The composite was released in May 2017.
How fast does the Crab pulsar spin?
It completes a turn about 30 times a second, so its beam sweeps past Earth every 33 milliseconds. That rotation, and the magnetic field it drags around, supplies the energy that makes the entire nebula shine.